

Recommendation Engine
The most revolutionary slot floor product to ever come be released. It does the work of dozens of analysts and allows slot floor operators to see which machines they should add, remove, move, or reconfigure.
It’s the result of 2 quarters of user research, whiteboarding, prototyping, and design. It was the most demo-ed product at G2E 2019. It’s the software that casinos have been looking for and my team handled it perfectly. From initial meetings with the product team to dozens of phone calls with subject matter experts and users; we were able to produce a game-changing product in 2 quarters.
PROBLEMS TO SOLVE:
1) Help slot operators quickly see the changes their floor needs.
2) Integrate a data analytics software so we can track usage.
3) Explain our reasoning to skeptical slot operators.
HOW I SOLVED THEM:
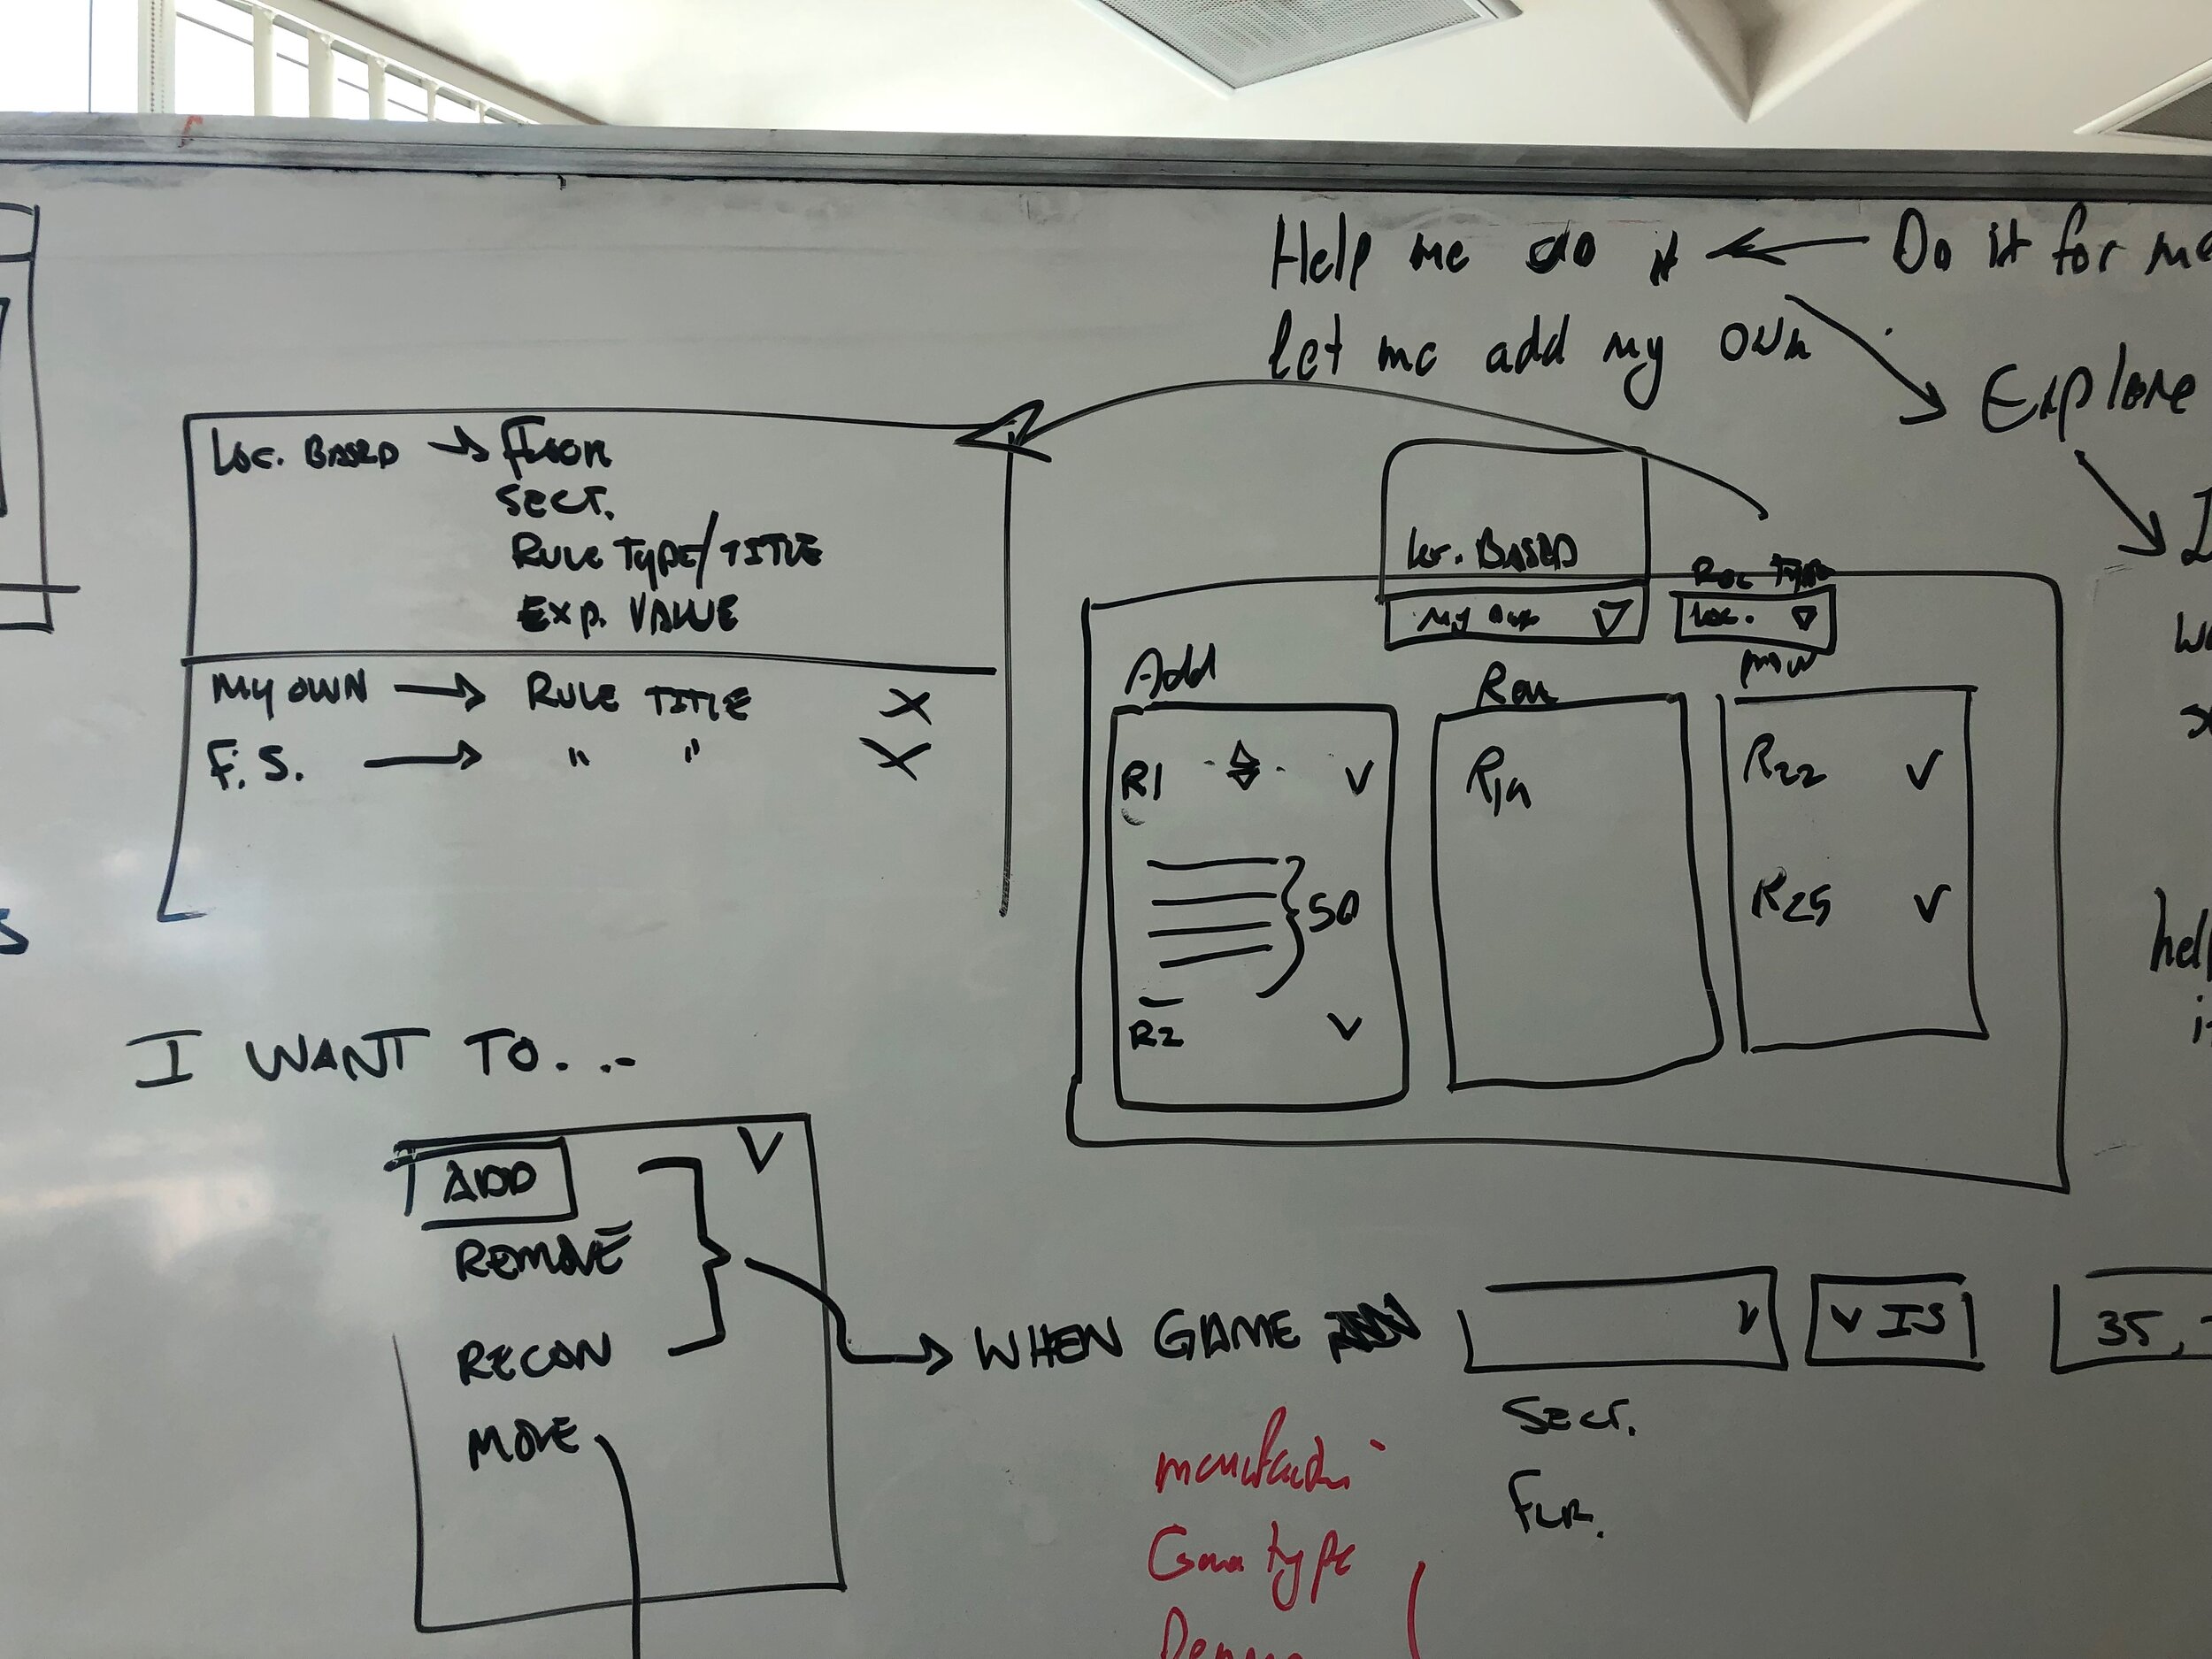
1) Because this product was brand new, we spent a month front loading user interviews with slot operators. We had countless conversations, formally and informally, to help us set up our ideas for a product. We had an initial idea, we wanted it to be recommendations from the floor. But we needed to understand standard metrics, needs, and pain points with their floor and their current software (if any). Once we gained that understanding, we were able to start whiteboarding. We ran initial concepts by our SMEs on staff before taking the drawings back to our users. We ran through several iterations after multiple conversations with our users. We landed on the appearance in the image above as the final version.
2) Our legacy products were all built in flash and had no user analytics in them. My goal was to implement Pendo into our new products and roadmap. Because our clients are tribal casinos, who do not want their data leaving their land, this posed a unique challenge. How can we get user data from the cloud, if they tribes do not want their data in the cloud? My first step was to get internal stakeholders onboard with the necessity of having user data. After several presentations, I had the support I needed to start socializing the idea with casino leadership. After talking with several casinos and their technical teams, I gained the necessary support. I was able to talk with Tribal Councils to gain their approval as well. I had to define what data would be sent and where, how safe the data would be, and how important it is for us and them. We now have Pendo implemented on our new products and receiving data daily.
3) The casino industry is a unique one, because there are many operators who go with their “gut.” They have been around since before data analytics and have made money due to their expertise and ability to try new things. This was a great challenge for us (Product Team), because we needed to create a product that could show our math. To do that we implemented a collapsible portion of each recommendation that revealed our numbers. Perception in UX is enormous, if people “feel” they can trust the data they will. We had multiple conversations internally and with users as to how best to accomplish that task. We did and it was a great success.
Skills Employed for this Project:
Work with product management on project objectives and allocate resources to achieve the objectives as measured against plans
Whiteboarding
Map, maintain and evangelize the end-to-end customer journey for this new experience
Lo-fi/Hi-Fi prototyping
Design and conduct qualitative and quantitative research studies, including user interviews, in-person or remote usability studies, focus groups and surveys
Product creation and iteration
Led the team of designers and PMs by establishing timelines and implementation
Led a remote dev team (New Zealand)
End-to-end product design from ideation to delivery
Tags:
User Experience, User Interface Design, Wireframing, User-centered Design, Interaction Design, Information Architecture, Product Management, Project Management, Data Analytics - Pendo, User Research, Business-to-Business (B2B), Management, Strategy, Roadmap


Post Forma
For most casinos, a post forma is done around 90 days after their campaign. This is a problem that has multiple reasons, but the most quoted reason from users is: busyness. They are too swamped with the monthly campaigns to tens of thousands of customers, that they rarely get a chance to determine the profitability of their campaigns. Through dozens of phone calls with users and subject matter experts, dozens of prototype testing we were able to put together a post forma that reads from our current campaign software. It will save users dozens of hours and empower marketing managers to prove the ROI of their campaigns. A simple dashboard with in-depth reporting and the ability to add hard expenses was “all it took” to satisfy our users.
PROBLEMS TO SOLVE:
1) Database Marketing teams need to see daily updates of their campaigns
2) Keeping track of hard expenses creates a clear picture of Campaign ROI
3) Responsive dashboard that can be viewed anywhere by executives and team members
HOW I SOLVED THEM:
1) As stated above, most marketing teams were not seeing their campaign results until 90 days AFTER the campaign had concluded. This discovery came through user interviews via phone and done in-person. It was a common theme that we were not expecting. This led us to discuss internally what a post forma would look like. Initial conversations were based around a SMEs excel spreadsheet. I scrapped the data tables because our users did not want more tables. They were wanting to get a glance of their live campaigns and send that information to their managers and executives. Our final version hit all of the major metrics, our roadmap includes adding in a calendar and some charts.
2) Hard expenses was a great challenge. There are lots of nuances to adding expenses for casino campaigns, we discovered. We had a few of our users walk us through their process. You have to be able to attribute dozens of expenses to a specific campaign. Sometimes you will split an expense over several campaigns. You also need to assign it a per unit cost. We distilled that data into its simplest form and based our interface on Google Forms (we use Material Design Principles as the basis for design system). That took several iterations and a few passionate discussions about the best user flow and interface. To see a final version, hit the link below and click on “Edit” in the “Expenses” card.
3) This was probably the easiest part of the whole product. Once we had confident data in our dashboard design it was a straightforward design to integrate mobile/tablet capability. Each set of cards was designed to mobile widths and stacked by section. The whole dashboard can exported as a png, so that users can send reports to their executives/managers.
Skills Employed for this project:
Work with product management on project objectives and allocate resources to achieve the objectives as measured against plans
Whiteboarding
Map, maintain and evangelize the end-to-end customer journey for this new experience
Lo-fi/Hi-Fi prototyping
Design and conduct qualitative and quantitative research studies, including user interviews, in-person or remote usability studies, focus groups and surveys
Product creation and iteration
Led the team of designers and PMs by establishing timelines and implementation
Led a remote dev team (New Zealand)
Tags:
User Experience, User Interface Design, Wireframing, User-centered Design, Interaction Design, Information Architecture, Product Management, Project Management, Data Analytics - Pendo, User Research, Business-to-Business (B2B), Management, Strategy, Roadmap


Rivet App
Rivet, a Santa Monica startup, that wants to become a major player in helping you manage your subscriptions came to me to create their first-time user flow and help establish their UI. After a few rounds of whiteboards and user interviews. We were able to settle on the following workflow.
PROBLEMS TO SOLVE:
1) Remove pain points from a complex onboarding flow.
2) Standardize the UI.
3) Remove unnecessary steps where applicable.
HOW I SOLVED THEM:
1) After talking through the user flow and goals of the onboarding experience. I reached out to 5 potential users and asked them if I could watch them go through the experience. We discovered that several screens were too complex and unnecessary. We went back to whiteboarding. Came up with a streamlined onboarding flow and tested again. This time there was an increase in comprehension and completion.
2) Standardizing the interface helped increase legibility of the onboarding flow by 20%.
3) Through testing and iterating we were able to remove 4 unnecessary screens and steps.
Hit the link below to see the prototype that is now live.
Skills Employed for this Project:
Work with client on project objectives
Refine user journey
Lo-Fi/Hi-Fi prototype
Collaborate with dev to ensure usability and design
User Interviews
Tags:
User Experience, User Interface Design, Wireframing, User-centered Design, Interaction Design, User Research, Business-to-Consumer (B2C), Qualitative Research

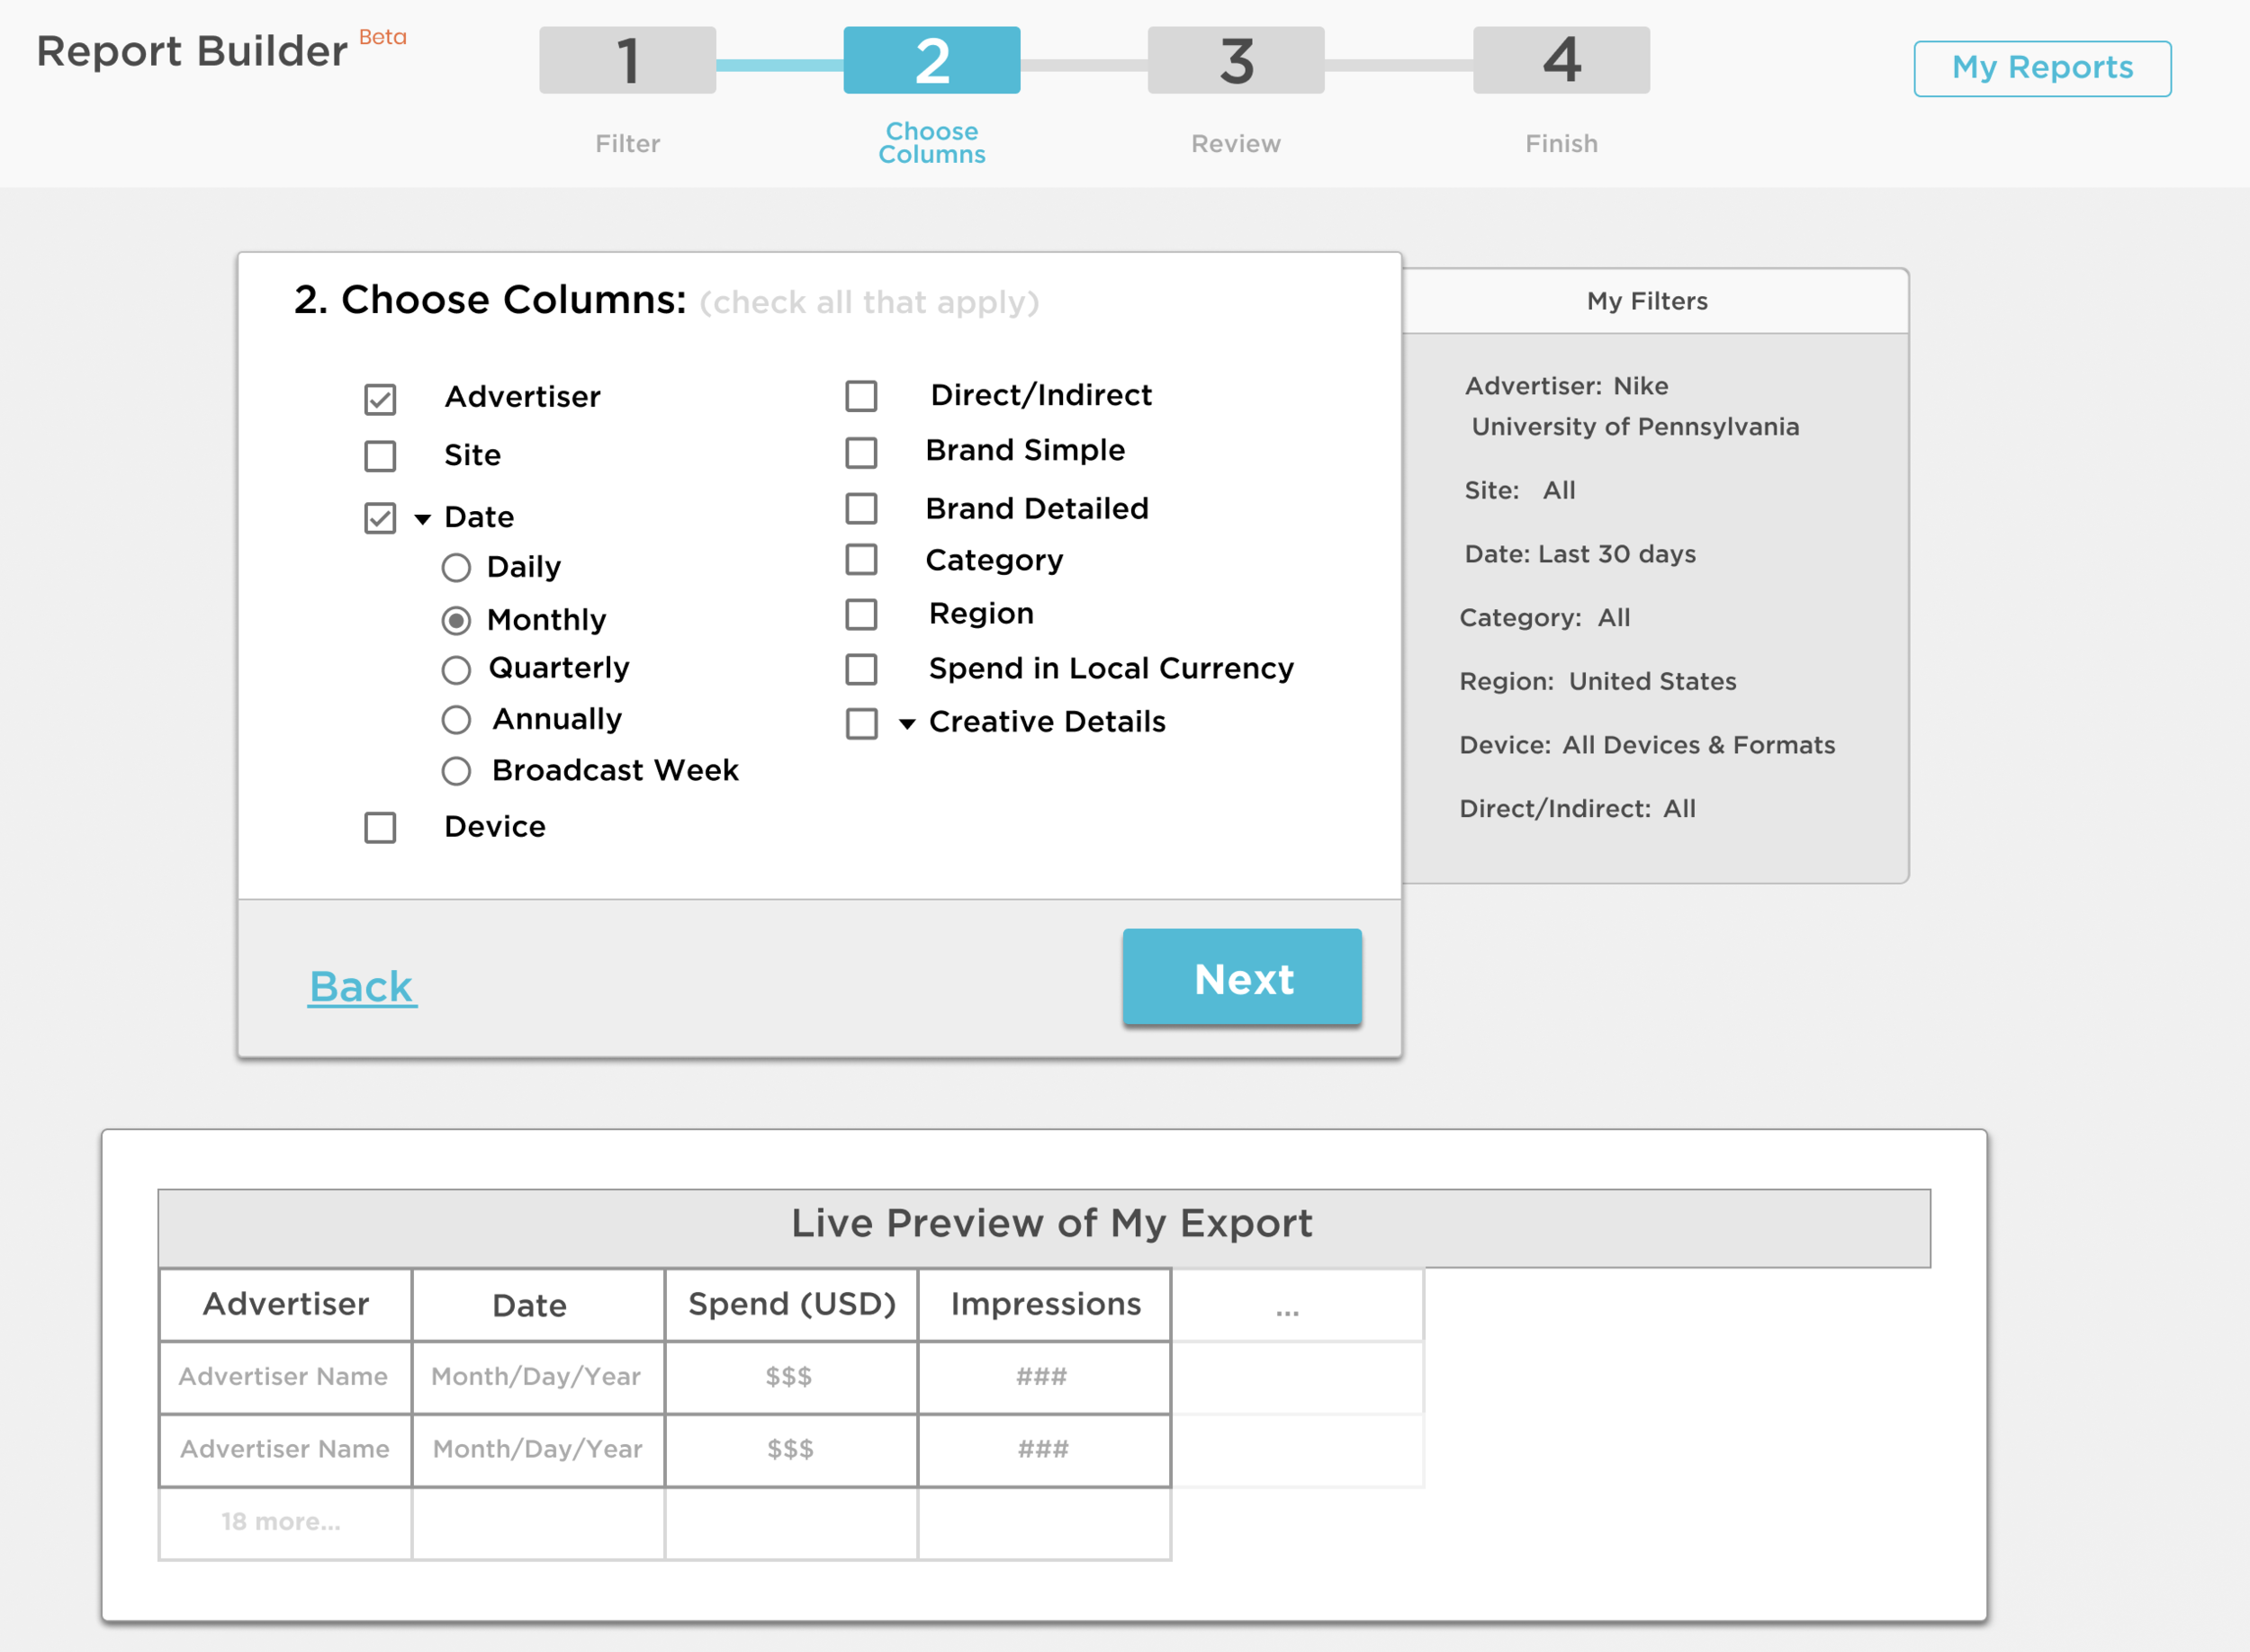
Report Builder
For any B2B, data analytics company, reports are HUGE. Pathmatics was in the perfect position to release a simple report builder that would allow their brand name clients to download the best marketing analytics data in the world. We worked together with users and the product team to release a report builder that made getting competitive analysis easier and faster than previous efforts.
Tags:
User Experience, User Interface Design, Wireframing, User-centered Design, Interaction Design, Information Architecture, Product Management, Project Management, Data Analytics - Pendo, User Research, Business-to-Business (B2B), Management, Strategy, Roadmap
Skills Employed for this project:
Work with product management on project objectives and allocate resources to achieve the objectives as measured against plans
Whiteboarding
Map, maintain and evangelize the end-to-end customer journey for this new experience
Lo-fi/Hi-Fi prototyping
Design and conduct qualitative and quantitative research studies, including user interviews, in-person or remote usability studies, focus groups and surveys
Product creation and iteration
Led the team of designers and PMs by establishing timelines and implementation


Telematics Dashboard (name withheld for privacy reasons)
Problem: Clunky, old, programmer-built dashboard for a global telematics company. Hidden menus, no usability flow, Windows 2000-esque appearance.
Insights: Through some user testing, and surveys we were able to define a couple of pain points that could be eased with a more direct user interface.
#1 - Reports were not being accessed, or rarely being accessed, due to being hidden in a small menu.
#2 - Widgets were not being used because they were not simple enough.
#3 - Widgets and reports are virtually the same thing.
#4 - Some reports do not show visually appealing data, or potentially have too much data. (For example, hundreds of points of interest on a given driver’s route x multiple drivers.)
Tags:
User Experience, User Interface Design, Wireframing, User-centered Design, Interaction Design, Information Architecture, Product Management, Project Management, User Research, Business-to-Business (B2B), Remote Dev Team (India)
Skills Employed for this project:
Work with product management on project objectives and allocate resources to achieve the objectives as measured against plans
Whiteboarding
Map, maintain and evangelize the end-to-end customer journey for this new experience
Lo-fi/Hi-Fi prototyping
Design and conduct qualitative and quantitative research studies, including user interviews, in-person or remote usability studies, focus groups and surveys
Product creation and iteration
Led a remote team of designers (India) by establishing timelines and implementation